

Türkiye export statistics
 Türkiye's exports to Saudi Arabia
As Türkiye declares its exports and Eurostat publishes them, month by month, about two months behind.
No free trade agreement; Türkiye–GCC talks under wayMinistry of Trade, checked 9 November 2026(opens in a new tab)First figures for October 2026
Out in the first days of the next month, before the statistics by product further down.
Exporters' registrations (TİM)
- Exports to Saudi ArabiaOctober 2026
- US$382.3m
- +83.9% on a year before
- Year to dateJanuary – October 2026
- US$2.683bn
- +21.9% on a year before
Source: Türkiye İhracatçılar Meclisi (TİM). These are registrations through the exporters' associations, not the general trade system: they differ from the Ministry's and Eurostat's figures.
Table: TİM İhracat Rakamları: Ülkeler Konsolide(opens in a new tab)Published at the source on 3 November 2026.
First official figures (Ministry of Trade)
- Türkiye's exports to all countriesOctober 2026
- US$25.88bn
- +8.1% on a year before
- Exports to Saudi ArabiaOctober 2026, rank 16 of 20
- US$479.2m
- +76.2% on a year before
The Ministry's release for October 2026(opens in a new tab)
Source: T.C. Ticaret Bakanlığı. Provisional figures of the general trade system: the month from the Ministry's records, earlier months from TÜİK's.
Table: Ticaret Bakanlığı: En Fazla İhracat Yapılan 20 Ülke(opens in a new tab)Published at the source on 3 November 2026.
Türkiye's daily export record: US$2.428bn on 22 May 2026.Ministry of Trade(opens in a new tab)
In numbers
- Last monthAugust 2026
- €238.8m
- ≈ US$277m
- +19% on a year before
- August 2025: €201m · ≈ US$233m
- Year to dateJanuary – August 2026
- €1.815bn
- ≈ US$2.11bn
- +4.4% on a year before
- January – August 2025: €1.74bn · ≈ US$1.92bn
- Last year2025
- €2.977bn
- ≈ US$3.37bn
- -4% on a year before
- 2024: €3.1bn · ≈ US$3.35bn
- Last 12 monthsSept 2025 – Aug 2026
- €3.052bn
- ≈ US$3.55bn
- +8.5% on a year before
- Sept 2024 – Aug 2025: €2.81bn · ≈ US$3.08bn
Source: Eurostat, dataset DS-059341: Türkiye's own declarations. Updated at the source on 16 October 2026. · Sept 2024 – Aug 2026
Dollar figures (≈) are converted at each month's own average rate; sums of months month by month. Rates: the European Central Bank, EXR.M.USD.EUR.SP00.A (the monthly average of its euro reference rates), September 2021 to August 2026; August 2026: €1 = 1.1593. The conversion is Birlesa's; the European Central Bank bears no responsibility for it.
Top 20 products
Türkiye's exports to Saudi Arabia over the last 12 months (Sept 2025 – Aug 2026), by HS heading. Each leads to its export scorecard.
Share in the market: Türkiye's share of Saudi Arabia's own imports and its place among the suppliers, with China's, India's and Egypt's (May 2025 – Apr 2026; source: UN Comtrade (United Nations Statistics Division)). Not shown where the market's own figures do not hold the product.
- 1GTİP 5702Carpets and other textile floor coverings; woven, (not tufted or flocked), whether or not made up, including kelem, schumacks, karamanie and similar hand-woven rugs€233m≈ US$272m7.7%+0.5%70.2% · No. 1China 7.1%India 1.9%Egypt 18.5%Share in the market: Türkiye 70.2% (No. 1) · China 7.1% · India 1.9% · Egypt 18.5%
- 2GTİP 8504Electric transformers, static converters (e.g. rectifiers) and inductors€169m≈ US$197m5.5%+102.9%3.6% · No. 3China 71.2%India 1.8%Egypt 0.3%Share in the market: Türkiye 3.6% (No. 3) · China 71.2% · India 1.8% · Egypt 0.3%
- 3GTİP 6802Monumental or building stone, worked (except slate) and articles thereof (not of heading no. 6801) mosaic cubes etc., of natural stone including slate; artificially coloured granules of natural stone€94.2m≈ US$110m3.1%-4.7%18.7% · No. 2China 24.3%India 5.8%Egypt 4.5%Share in the market: Türkiye 18.7% (No. 2) · China 24.3% · India 5.8% · Egypt 4.5%
- 4GTİP 8716Trailers and semi-trailers; other vehicles, not mechanically propelled; parts thereof€71.6m≈ US$83.8m2.4%+502.7%3.6% · No. 7China 44.9%India 2.7%Egypt 0.2%Share in the market: Türkiye 3.6% (No. 7) · China 44.9% · India 2.7% · Egypt 0.2%
- 5GTİP 1512Sun-flower seed, safflower or cotton-seed oil and their fractions; whether or not refined, but not chemically modified€58.2m≈ US$67.8m1.9%+38%16.1% · No. 3India <0.1%Egypt 3.4%Share in the market: Türkiye 16.1% (No. 3) · India <0.1% · Egypt 3.4%
- 6GTİP 7113Jewellery articles and parts thereof, of precious metal or of metal clad with precious metal€57.8m≈ US$67.2m1.9%+12%—
- 7GTİP 1806Chocolate and other food preparations containing cocoa€55.5m≈ US$64.6m1.8%-6%7.2% · No. 4China 2.4%India 2.5%Egypt 22.1%Share in the market: Türkiye 7.2% (No. 4) · China 2.4% · India 2.5% · Egypt 22.1%
- 8GTİP 6204Suits, ensembles, jackets, dresses, skirts, divided skirts, trousers, bib and brace overalls, breeches and shorts (other than swimwear); women's or girls' (not knitted or crocheted)€49.8m≈ US$58m1.6%-19.3%2.9% · No. 8China 49.2%India 6.7%Egypt 0.4%Share in the market: Türkiye 2.9% (No. 8) · China 49.2% · India 6.7% · Egypt 0.4%
- 9GTİP 9403Furniture and parts thereof, n.e.c. in chapter 94€37.4m≈ US$43.6m1.2%-42.6%5.3% · No. 4China 45.6%India 2.4%Egypt 1.6%Share in the market: Türkiye 5.3% (No. 4) · China 45.6% · India 2.4% · Egypt 1.6%
- 10GTİP 1905Bread, pastry, cakes, biscuits, other bakers' wares, whether or not containing cocoa; communion wafers, empty cachets suitable for pharmaceutical use, sealing wafers, rice paper and similar products€35.3m≈ US$41m1.2%-29%4.1% · No. 8China 1.1%India 1.3%Egypt 6.3%Share in the market: Türkiye 4.1% (No. 8) · China 1.1% · India 1.3% · Egypt 6.3%
- 11GTİP 7308Structures of iron or steel and parts thereof; plates, rods, angles, shapes, sections, tubes and the like, prepared for use in structures€34.3m≈ US$40m1.1%-56.9%5.4% · No. 5China 31.4%India 4%Egypt 5%Share in the market: Türkiye 5.4% (No. 5) · China 31.4% · India 4% · Egypt 5%
- 12GTİP 2836Carbonates; peroxocarbonates (percarbonates); commercial ammonium carbonate containing ammonium carbamate€27.8m≈ US$32.3m0.9%-15.6%29.8% · No. 1China 12.3%India 4.8%Egypt 3.9%Share in the market: Türkiye 29.8% (No. 1) · China 12.3% · India 4.8% · Egypt 3.9%
- 13GTİP 5703Carpets and other textile floor coverings (including turf); tufted, whether or not made up€26.8m≈ US$31.3m0.9%+10.3%32.3% · No. 1China 17.1%India 4.3%Egypt 1.3%Share in the market: Türkiye 32.3% (No. 1) · China 17.1% · India 4.3% · Egypt 1.3%
- 14GTİP 8702Vehicles; public transport passenger type€26.4m≈ US$30.7m0.9%+109.2%4.1% · No. 4China 52.6%India 3.3%Egypt 1.8%Share in the market: Türkiye 4.1% (No. 4) · China 52.6% · India 3.3% · Egypt 1.8%
- 15GTİP 8537Boards, panels, consoles, desks, cabinets, bases with apparatus of heading no. 8535, 8536 for electricity control and distribution, (other than switching apparatus of heading no. 8517)€26.3m≈ US$30.7m0.9%+53.2%2.5% · No. 10China 38.1%India 3.6%Egypt 2%Share in the market: Türkiye 2.5% (No. 10) · China 38.1% · India 3.6% · Egypt 2%
- 16GTİP 3304Cosmetic and toilet preparations; beauty, make-up and skin care preparations (excluding medicaments, including sunscreen or sun tan preparations), manicure or pedicure preparations€24.5m≈ US$28.6m0.8%-0.2%2.3% · No. 10China 9.1%India 1.9%Egypt 0.8%Share in the market: Türkiye 2.3% (No. 10) · China 9.1% · India 1.9% · Egypt 0.8%
- 17GTİP 1507Soya-bean oil and its fractions; whether or not refined, but not chemically modified€23.9m≈ US$27.8m0.8%+23.8%31.1% · No. 1China 1.9%India 0.9%Egypt 18%Share in the market: Türkiye 31.1% (No. 1) · China 1.9% · India 0.9% · Egypt 18%
- 18GTİP 8431Machinery parts; used solely or principally with the machinery of heading no. 8425 to 8430€23.8m≈ US$27.8m0.8%+35.5%1.2% · No. 12China 25.4%India 1.6%Egypt 0.1%Share in the market: Türkiye 1.2% (No. 12) · China 25.4% · India 1.6% · Egypt 0.1%
- 19GTİP 7305Iron or steel (excluding cast iron); tubes and pipes (e.g. welded, riveted or similarly closed), having circular cross-sections, external diameter of which exceeds 406.4mm, not seamless€23.4m≈ US$27.4m0.8%-5.1%11.8% · No. 4China 34.8%India 16.6%Egypt <0.1%Share in the market: Türkiye 11.8% (No. 4) · China 34.8% · India 16.6% · Egypt <0.1%
- 20GTİP 8418Refrigerators, freezers and other refrigerating or freezing equipment, electric or other; heat pumps other than air conditioning machines of heading no. 8415€23.1m≈ US$26.8m0.8%-20.7%2.9% · No. 6China 46.9%India 1.6%Egypt 1.2%Share in the market: Türkiye 2.9% (No. 6) · China 46.9% · India 1.6% · Egypt 1.2%
Arms and ammunition (chapter 93), unwrought precious metals and coins, and special codes (chapter 99) count in every total but are not ranked.
Source: Eurostat, dataset DS-059341: Türkiye's own declarations. Updated at the source on 16 October 2026. · Sept 2024 – Aug 2026
By sector, the same week (TİM)
Türkiye's export registrations to Saudi Arabia, January – October 2026, by TİM's sectors, the largest first.
- Electrical and electronicsUS$325m12.1%+87.8%
- Chemicals and chemical productsUS$313m11.7%+31.7%
- Cereals, pulses, oilseeds and their productsUS$288m10.7%-6.9%
- CarpetsUS$256m9.5%+6.1%
- Machinery and partsUS$157m5.8%-8.2%
- Ferrous and non-ferrous metalsUS$107m4%-24.7%
- Mining productsUS$95.7m3.6%-1.6%
- Apparel and clothingUS$95.3m3.6%+1.3%
The 8 largest of 25 sectors.
Source: Türkiye İhracatçılar Meclisi (TİM). These are registrations through the exporters' associations, not the general trade system: they differ from the Ministry's and Eurostat's figures.
Table: TİM İhracat Rakamları: Ülkelere Göre Sektörel(opens in a new tab)Published at the source on 3 November 2026.
The last five years
Türkiye's exports to Saudi Arabia each month, Sept 2021 – Aug 2026.
In millions of euros
Every month as a table
| Month | Exports | ≈ US dollars |
|---|---|---|
| August 2026 | €238,786,285 | US$276,827,213 |
| July 2026 | €206,988,010 | US$236,328,111 |
| June 2026 | €380,502,436 | US$438,262,706 |
| May 2026 | €216,496,413 | US$252,720,593 |
| April 2026 | €224,090,207 | US$262,328,960 |
| March 2026 | €134,567,127 | US$155,536,967 |
| February 2026 | €223,897,633 | US$264,735,442 |
| January 2026 | €189,432,494 | US$222,360,372 |
| December 2025 | €635,961,673 | US$744,629,353 |
| November 2025 | €222,841,838 | US$257,609,622 |
| October 2025 | €191,490,791 | US$222,712,116 |
| September 2025 | €187,242,414 | US$219,677,056 |
| August 2025 | €200,604,050 | US$233,331,168 |
| July 2025 | €190,914,485 | US$222,928,355 |
| June 2025 | €162,935,501 | US$187,639,627 |
| May 2025 | €215,775,684 | US$243,352,844 |
| April 2025 | €214,205,174 | US$240,208,611 |
| March 2025 | €247,185,702 | US$267,128,879 |
| February 2025 | €283,832,542 | US$295,540,634 |
| January 2025 | €223,596,518 | US$231,505,737 |
| December 2024 | €311,543,229 | US$326,458,361 |
| November 2024 | €269,927,808 | US$286,937,117 |
| October 2024 | €270,572,222 | US$295,041,361 |
| September 2024 | €223,279,537 | US$247,974,254 |
| August 2024 | €231,522,505 | US$254,956,792 |
| July 2024 | €201,409,803 | US$218,410,543 |
| June 2024 | €184,898,203 | US$198,931,977 |
| May 2024 | €325,101,574 | US$351,507,211 |
| April 2024 | €220,826,845 | US$236,897,781 |
| March 2024 | €340,922,028 | US$370,657,247 |
| February 2024 | €263,717,356 | US$284,675,351 |
| January 2024 | €255,578,725 | US$278,712,086 |
| December 2023 | €275,181,882 | US$300,032,253 |
| November 2023 | €208,983,101 | US$225,873,686 |
| October 2023 | €202,561,385 | US$213,956,385 |
| September 2023 | €165,638,787 | US$176,965,325 |
| August 2023 | €178,834,114 | US$195,087,803 |
| July 2023 | €133,019,785 | US$147,095,179 |
| June 2023 | €156,739,072 | US$169,903,016 |
| May 2023 | €157,872,243 | US$171,567,660 |
| April 2023 | €160,115,615 | US$175,610,359 |
| March 2023 | €230,815,737 | US$247,107,314 |
| February 2023 | €152,461,237 | US$163,363,740 |
| January 2023 | €190,011,863 | US$204,623,775 |
| December 2022 | €198,376,814 | US$210,057,429 |
| November 2022 | €178,999,900 | US$182,602,679 |
| October 2022 | €146,914,008 | US$144,352,808 |
| September 2022 | €144,349,349 | US$142,960,314 |
| August 2022 | €109,047,293 | US$110,447,840 |
| July 2022 | €41,093,573 | US$41,828,757 |
| June 2022 | €19,932,362 | US$21,060,171 |
| May 2022 | €3,768,376 | US$3,986,377 |
| April 2022 | €14,972,539 | US$16,198,396 |
| March 2022 | €50,850,976 | US$56,032,469 |
| February 2022 | €6,562,073 | US$7,442,638 |
| January 2022 | €5,474,851 | US$6,194,507 |
| December 2021 | €18,481,103 | US$20,890,637 |
| November 2021 | €7,434,126 | US$8,485,345 |
| October 2021 | €10,787,912 | US$12,515,570 |
| September 2021 | €42,320,427 | US$49,812,489 |
Source: Eurostat, dataset DS-059341: Türkiye's own declarations. Updated at the source on 16 October 2026. · Sept 2021 – Aug 2026
Who supplies Saudi Arabia
Saudi Arabia's own imports over May 2025 – Apr 2026, by country of origin: Türkiye's share against China, India and Egypt.
Türkiye supplies 1.5% of these imports and ranks 14 of 218 suppliers.(0 points on a year before)
- 1
 China28.6%US$72.2bn+3.1 pts
- 2
 United States8.1%US$20.5bn-0.4 pts
- 3
 United Arab Emirates6.3%US$15.9bn+0.9 pts
- 4
 India4.5%US$11.4bn-0.6 pts
- 5
 Germany4.3%US$10.9bn-0.1 pts
- 6
 Japan3.9%US$9.79bn+0.1 pts
- 7
 Italy3.3%US$8.22bn-0.2 pts
- 8
 Switzerland3.2%US$7.98bn+0.5 pts
- 9
 France2.8%US$7.11bn+0.6 pts
- 10
 Egypt2.7%US$6.77bn-0.5 pts
- 14Türkiye1.5%US$3.81bn0 pts
Shares of Saudi Arabia's total imports. China, India and Egypt are shown wherever they rank.
Source: UN Comtrade (United Nations Statistics Division).
Table: UN Comtrade C/M/HS, TOTAL(opens in a new tab)Published at the source on 30 July 2026.
Opportunities in Saudi Arabia
Tenders, buyers' requests and buying signals from Saudi Arabia are on its country page.
Twenty Turkish products, their scorecards ready
Tap one to watch its scorecard build from today's data. Examples never use your searches.
 Hotel towelsDenizli · Textiles
 Machine-made carpetsGaziantep · Textiles
 Upholstery fabricBursa · Textiles
 Bed linen and sheetsDenizli · Textiles
 Children's clothingIstanbul · Apparel
- JeansIzmir · Apparel
 Sofa and living-room setsKayseri · Furniture
- Hotel furnitureİnegöl · Furniture
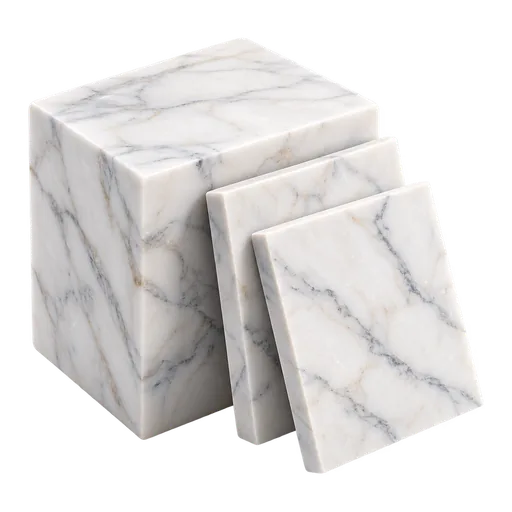 Cut marbleAfyon · Building materials
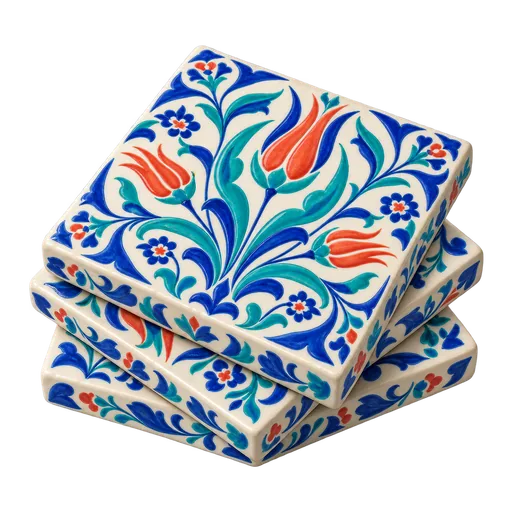 Ceramic tilesKütahya · Building materials
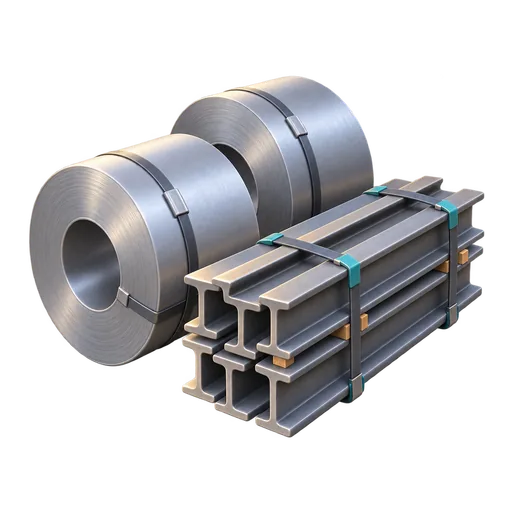 Steel rebarİskenderun · Building materials
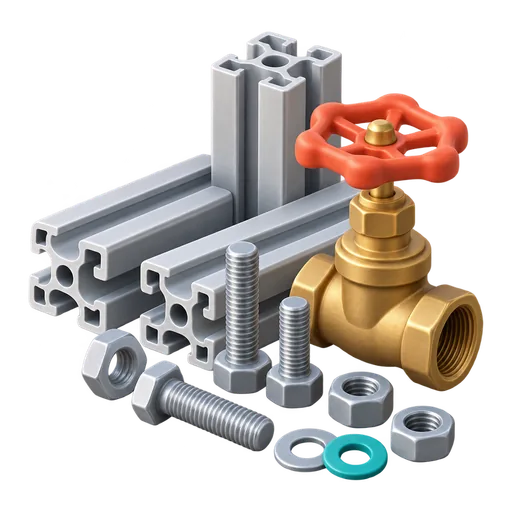 Aluminium profilesKocaeli · Building materials
 PVC pipesAdana · Building materials
 HazelnutsGiresun · Food
 Olive oilIzmir · Food
 Dried apricotsMalatya · Food
 BaklavaGaziantep · Food
 PastaGaziantep · Food
 Citrus (lemons)Mersin · Food
 Stainless steel kitchenwareIstanbul · Household goods